What do people expect when machines do the data extraction? What is perfect data, anyway, and how good are people at recognizing it?
How it went
Our company extracts data points like names, prices, addresses and more from documents submitted by our users; the extraction is done by machine learning models. Along with the data, a pass or fail score is included to help our users know whether or not it was ‘trustworthy’ data’ – or data that was at least 95% accurate.
We needed to validate that our concept of ‘pass’ and ‘fail’ met the expectations of our users. Also – How good did our users expect our models to perform? What does accurate data mean, anyway, to our users?
However, before we could delve into validating our pass and fail with our users, we had to better understand the relationship between people and machines.
I researched how good humans tended to be at manual data extraction, what helped humans perform that extraction better, and what sort of inherent pain points existed with manual data extraction. Thankfully, this is a well covered topic with several scholarly scores providing statistics, scores and more.
With those two pieces of knowledge in hand, I broke the problem into two parts. While the second section would determine if our pass and fail marks met user expectations – I wanted to first understand how well people were at judging accurate data returns, or data returns with mistakes in them. I theorized that knowing how good people were at judging data could help guide our process more accurately – if people didn’t recognize mistaken data returns, how well should we trust their judgment on our pass/fail? And how may we need to account for any gaps?
For the first section, I asked – How good are people at recognizing errors in data extraction, and how good are they at recognizing perfectly extracted data? I hypothesized (1):
- Novice users will find pure numbers and pure text returned from extraction easier to read, and identify as passing or failing data.
Once we had those hypotheses validated (or not), we could move on to understanding how our scoring aligned with user expectations.
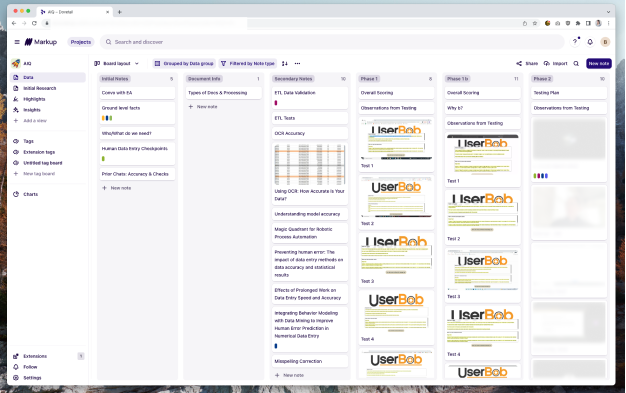
To understand how well people assessed data, I set up a series of unmoderated, qualitative tests with eight novice users (2). The first part of the test asked our participants to look at a document on the left, and the “machine learning” powered data extraction results on the right with the pass/fail score on top.
After a set amount of time, the tester was asked if they agreed with our pass or fail score. I showed mixed examples of each situation: the pass or fail score improperly or properly set for the data results.
Then I showed, in the same format, original documents and data without the scoring, and after a set amount of time I asked the tester what they thought the score ought to be, either pass or fail. Using the results from these tests, I was able to get a sense of how people fare with recognizing good data.
In the end, the results showed that people showed no difference when it came to viewing text, numerical data, or a mix of both. People were remarkably close when it came to identifying what data sets contained mistakes. However, the biggest surprise was that people failed to recognize, or acknowledge, perfect data (3). This also highlighted a possible risk for us – no matter how good our results might be, people wouldn’t believe in the data.
So people could see most of the mistakes, but didn’t quite trust the results when no mistakes appeared. I shared these results with the team (our data scientists and product folks). I reviewed our hypotheses going into the testing, how we tested and why, and what the results likely meant.
Knowing that people’s gut sense of when results had mistakes was sharp, but there is risk in perfect data, I set off to continue the research to answer the question of, “Do our users agree with our pass/fail grades for data?”
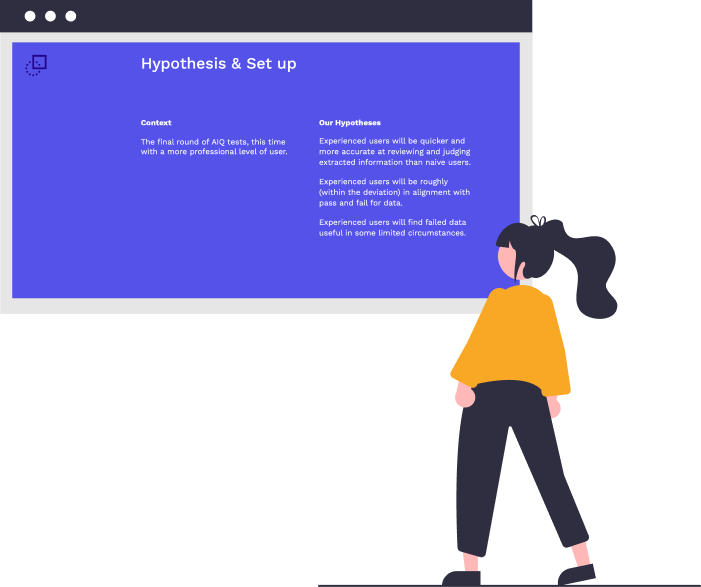
For this qualitative test – I set out to talk to seven expert users (4) in a moderated test with some interview questions at the end. The test set up was similar to the first round. This round, I speculated that:
- Experienced users will be quicker and more accurate at reviewing and judging extracted information than naive users.
- Experienced users will be roughly (within the deviation) in alignment with pass and fail for data.
- Experienced users will find failed data useful in some limited circumstances.
I ran tests similar to the first round of testing: asking people to compare original documents with extracted data. I asked if they agreed with our grading, and what sort of grades they would give some example extractions. For the latter – I had the actual grading from our machine extraction results to compare to the perceptions of our testers. With a moderated test – I was also able to ask questions on if people would use data marked pass or fail, and understand more of the nuances of the levels of trust in machine extracted data.
Our expert testers turned out to be better at gauging mistakes. While there was complete agreement on data results marked ‘pass’, there was not a solid consensus on what data results should be considered a ‘fail’ or not. Several users expressed interest in using failed data groups if they knew why the failing grade had been applied – but only then.
There are a few reasons why we had mixed results on failed data – there was a mismatch of people’s assumptions of how machine-learning data extraction worked, and the reality; and the lack of information behind why something was marked as ‘fail’.
Overall, I came to several conclusions and developed takeaways for the team, and next steps based on that data. We can’t depend on knowledge of machine learning to be able to use our product – but we can give people more information to guide them through the results and be as efficient as possible when it comes to using the data.
Firm in our passing score, and with the knowledge that our ‘failed’ data may still be useful – I shared an overview of the process, the results and actionable next steps with the team.
We took immediate steps to clarify some of the types of data we were returning, and the team planned for longer term updates and further investigation into what we could return to the user along with the data itself to help navigate and trust our results.
Endnotes
1 – Recognizing that qualitative work ought to not have specific questions or hypotheses defining them, I still like to have a direction or statement that I can validate or dismiss at the end of the testing effort when working within the time and money constraints of an early stage startup. Too broad an effort does not result in immediate, actionable takeaways, which is often what these sorts of companies need at this stage.
2 – The goal with novice users was to ensure that the newest person to our system would be able to navigate through without issues. Once tested with novice users, we planned to test with expert users as well at a later date.
3 – I had ensured the data was perfect with “Researcher as the extraction model” and triple checking data points.
4 – I talked to professional users who, in some way, handle data entry and/or deal with commercial real estate documents in some form.